One of the most dangerous tasks a police officer performs is the apprehension of moving vehicles. Whether it’s for a traffic infraction, speeding or fleeing a murder scene, it is important for police to catch up to and initiate contact as quickly as possible with suspects. The shorter distance this can be accomplished, the less exposure to other motorists. Contrary to popular belief, a quicker patrol vehicle may actually improve safety for everyone.
Nothing pits different factions within a department against each other like the discussion about patrol cars. Command staff are worried about crash rates and liability. Accountants and fleet managers are worried about purchase price and total cost of ownership. Meanwhile, patrol officers just want a car that will perform well. They want a mobile office with a cup holder that will get up and go when needed with enough creature comforts to make a 12-hour shift behind the wheel livable.
Modern cars available to the public are faster than they have ever been in the history of the automobile. Even a lowly minivan like the Honda Odyssey has a 0-60 time of around 6.6 seconds. Ford’s largest SUV, the Expedition with an EcoBoost 3.5L V6, clicks off a 0-60 time of 5.7 seconds, faster than an All-Wheel Drive Dodge Charger with Hemi 5.7L V8. The reality is that modern police vehicle performance lags behind some of the most popular sedans and trucks available to the general public. The danger lies in the fact that the more time and distance required to match a violator’s speed, the longer an officer has to over-drive their car’s capability and their driving skillset.
The single most important factor should not be what a car’s top speed is, but rather on how much time a vehicle spends at 90 mph and above doing routine patrol work. If an officer crashes at 90 mph they have a high probability of being killed. Crashing at 100, 130 or even 150 mph just determines whether the funeral is open or closed casket. Therefore, if we look at 90 mph as the threshold for fatality, then it is imperative to find ways to reduce the amount of time a patrol officer must spend above 90 mph during routine patrol work.
Another important metric that needs to be considered is horsepower to weight ratios. While marketing a car with 365 horsepower sounds great, the reality is that if that car weighs 5,200 pounds it requires all of that horsepower just to provide below-average performance. Thus a change in focus from raw horsepower to power to weight ratios can provide a much better insight into vehicle performance.
Tests like Michigan State Police and Los Angeles Sheriff’s Department use vehicles that are empty. These departments do an incredibly thorough job of testing vehicles and little could be done to improve their current methodology; while their current testing procedures are excellent for measuring patrol vehicles against each other, however, neither agency factors in how those vehicles will do with a patrol load.
Recently, an unnamed U.S. agency began a new test of three different makes and models of vehicles at their patrol weight.
Criteria for testing
To evaluate the impact of patrol weight in this new test, several examples of each make of vehicle were pulled from the field at random in their “as-driven” configuration. All the officers’ gear, as well as a full tank of fuel, were weighed and averaged. Specialty vehicles like K9, accident reconstruction, search and rescue, and commercial vehicle enforcement were excluded because of the added weight of cages, dive tanks, scales and survey equipment that very few officers have. Because this agency issues take-home vehicles, issued equipment is augmented with an officer’s personal selection of additional patrol equipment. This causes fairly significant variances in weight between vehicles.
For simplicity, we will refer to these cars simply by their finishing order: One, Two and Three. The make and model of the vehicles is less important than their performance numbers. This will allow us to put personal brand bias and perception aside and focus solely on the performance numbers.
What was discovered was the average patrol weight of each different make and model was between 377 and 753 pounds heavier than MSP’s test weight for the same cars. The average was 591 additional pounds.
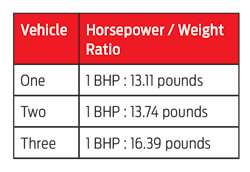
By dividing test weight by the advertised horsepower (also known as brake horsepower or BHP), the horsepower to weight ratio of each of the three vehicles was calculated. In other words, the amount of weight every horsepower needs to move. This horsepower to weight ratio had a direct impact on vehicle performance.
A simple test was devised to determine how fast a stationary patrol-weight vehicle could catch a violator at speeds of 80, 90 and 100 mph traveling in straight line. Several factors were analyzed:
- Time over 90 mph
- Distance to capture
- Time to capture
- Top speed at capture
Time above 90 mph deals directly with the risk to the driver at these speeds since both driver and vehicle are approaching maximum performance limits. At speeds above this threshold, safety systems like Active Handling and ABS will have greatly reduced effectiveness because the tires are using almost all available grip for acceleration, leaving little grip left over for braking or turning. Long times spent driving at these speeds is akin to more rolls of the dice at the craps table — roll long enough and eventually you’re going to lose. Unfortunately, in a patrol situation losing on the street has much higher consequences.
Distance to capture deals directly with the risk to the public. Using screen captures from some interstate traffic cameras revealed that lightly traveled sections of multilane highways averaged 2.8 cars per 100-feet of roadway. A patrol car moving through a mile of traffic at this density would directly encounter more than 147 cars. During rush hour this traffic density would increase dramatically. The farther a patrol car travels to overtake a violator directly relates to the number of other cars it will affect. Each additional foot traveled represents additional risk to the public.
Time to capture is similar to both Time above 90 mph and distance to capture, but it is a measure of the overall time that both the public and the police driver are at risk. Again, the longer the patrol vehicle takes to overtake a violator, the longer everyone is in danger.
Finally, top speed at capture was surprisingly close between all three vehicles. This is not the published top speed of the vehicle; rather, this is the maximum speed attained by the test vehicle while overtaking the target vehicle. Even while attempting to overtake a target vehicle at 100 mph, no test vehicle achieved its maximum speed. Of additional note is that the slowest test car was only slower than the fastest car by less than 7 mph.
The test results
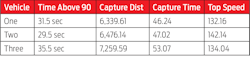
Looking at the results of the tests we can see that two “patrol weight” cars are fairly close in performance, while a third lags fairly far behind. With the target vehicle traveling at 80 mph here is how the three test vehicles performed:
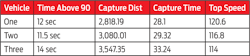
Based on these figures it’s easy to see that Vehicle Three not only spends the most time above 90 mph, but it also travels nearly 730-feet more than Vehicle One. If we use our previously determined traffic density of 2.8 cars per 100-feet of roadway, then Vehicle Two affected 7.3 more cars than Vehicle One. Meanwhile Vehicle Three encountered more than 20 civilian vehicles for the same task as Vehicle One, and more than 13 cars than Vehicle Two. Top speeds of all the vehicles are fairly close to each other but well away from each vehicle’s top speed.
If we skip ahead to a target vehicle speed of 100 mph, things get worse.
Vehicle Three again spends more time above 90 mph than Vehicle One or Two. The capture distance shows Vehicle Two affecting 3.8 more cars than Vehicle One. Vehicle Three affects 25 more cars than Vehicle One and nearly 22 more than Vehicle Two. Top speeds are at the maximum for Vehicle Three but still fairly far for Vehicle One and Two.
From this data we can see that at patrol weight Vehicle Three struggles to perform routine overtaking tasks. It spends the most time at 90 mph and faster, affects more civilian traffic because of the long distance to catch a violator, and takes the longest time to catch a violator. Time above 90 for Vehicle Three places the driver at more risk, longer capture distance puts the public at more risk, and longer capture times places everyone at more risk.
Performance can be increased for free by shaving weight. Reduce mandated equipment that gets little use in the field like gas masks and code books. Change to internal light bars instead of external light bars to reduce weight and aerodynamic drag. It is time to start finding ways to reduce time above 90 mph, capture distance, and capture time to increase safety for everyone. If patrol load cannot be reduced, then this may mean that it’s time to buy better performing cars.
About the Author
Christopher Ihara is a law enforcement officer with more than 14 years on the job. He wears many hats as a certified RADAR and LIDAR instructor, a professional automotive journalist, photographer, inventor and an instructor of high performance and EVOC driving.
About the Author
Christopher Ihara
President
Christopher Ihara is the President of Blacktop Bootcamp – The Driving Arts Immersion School. He has been instructing high performance and advanced driving schools since 1997.