Comparable Data, Actionable Strategies: How Police Comparison Dashboards Track Crash Trends
What to Know
- Comparison dashboards provide agencies with contextual benchmarks against statewide, similar-sized, and peer agencies to track crash trends over time.
- Focused on key safety metrics like injuries, DUI involvement, and speed-related crashes, presented as percentages for fair comparisons across different agency sizes.
- Enable proactive enforcement by identifying high-risk locations and patterns, supporting targeted interventions to prevent crashes before they occur.

For officers on the street, the ability to have access to the highest level of training, technology and gear is essential. A growing number of law enforcement agencies are putting extra emphasis on arming them with data. When it comes to traf‑ fic safety and enforcement, key data points deliv‑ ered by software solutions can give agencies and officers added direction when it comes to preventing and respond‑ ing to crashes and other incidents on roadways.
OFFICER Magazine recently received insight from Eric Hobbs, Senior Director of Product Management at LexisNexis Coplogic Solutions, on how the company’s comparison dashboards allow agencies to compare trends benchmarked against neighboring agencies, including serious injury due to factors such as DUI and high speed, as well as injuries to passengers or pedestrians.
Can you talk about the comparison dashboards and how they work within Coplogic software?
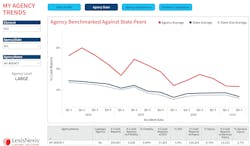
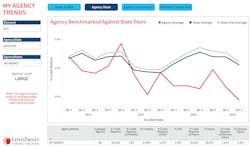
The comparison dashboards are purpose built to give agencies a comprehensive view of their crash data — not just in isolation, but in context. Agencies can bench‑ mark their performance against statewide averages, similar‑sized agencies, and peer agencies across the nation. Where most analytical tools offer a simple snap‑ shot, these dashboards provide benchmarking, allowing agencies to track and trend performance across key crash indicators. They serve as an important addition to a law enforcement agency’s analytical toolkit and integrate seamlessly with the other insights available through our Command Center portal.
What type of data is collected, and how is it presented?
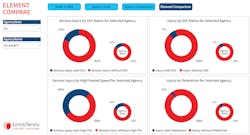
Our goal is to distill information found on a crash report into actionable insights. The dashboards focus on the data points that typically most directly influence public safety — such as injuries, airbag deployments, DUI involvement, speed‑related crashes, seatbelt usage, and pedestrian‑re‑ lated incidents. These metrics are presented as proportions (e.g., percent of crashes involving DUIs or serious injuries) rather than raw counts. Using percentages creates more fair, representative comparisons between agencies of different sizes. Beyond that, the dashboards sur‑ face three years of benchmarked historical data, enabling agencies to easily detect trends and measure progress over time.
What benefits do law enforcement agencies see from the dashboards?
Law enforcement’s mission is to keep communities safe, and reducing injuries and fatalities on the roadway is a major component of that mission. By viewing their data in the context of statewide norms, similar agencies, and peer jurisdictions, departments can more accurately identify potential issues or emerging trends. The ability to view data over time also provides meaningful feedback on initiatives. For example, an agency noticing elevated DUI‑related crashes can introduce targeted interventions and then use the dashboards to measure whether those actions are driving improvement relative to a baseline.
How can the use of these dashboards help prevent crashes?
The dashboards help prevent crashes by revealing patterns and issues that might not be immediately visible. By iden‑ tifying trends — such as higher‑than‑average DUI involve‑ ment — an agency can use other tools like Crash Mapper to drill deeper into exact locations, times, and contributing factors. These insights directly support proactive enforce‑ ment and resource deployment. For example, identifying DUI “hot spots” allows agencies to adjust patrol strategies, conduct targeted enforcement, and continually monitor whether interventions lead to fewer DUI‑related crashes
How can the use of the dashboards help clear crash scenes quicker?
The most effective way to clear a crash scene quickly is to prevent the crash from happening in the first place. By combining the comparison dashboards with the rest of the LexisNexis Coplogic analytical suite, agencies can shift from reactive response to proactive prevention. The dash‑ boards highlight patterns in crash types, frequencies, and high‑risk locations — information that helps agencies anticipate where resources may be needed. Better antic‑ ipation can help lead to more efficient resource staging, faster response times, and ultimately, improved roadway clearance and safety.
Do the dashboards help increase officer awareness when it comes to traffic safety?
The dashboards help build a culture of proactive traffic safety awareness. By surfacing meaningful patterns in both historical and current crash data, officers and com‑ mand staff can gain clearer visibility into the risks within their communities. This helps empower departments to make better‑informed decisions and reinforce traffic safety priorities across the department.
Are there any success stories that come to mind?
One standout success story comes from the Lansing Police Department, which used comprehensive crash data and targeted interventions to dramatically improve traffic safety in high‑accident areas. After analyzing collision types, contributing factors, and traffic flow patterns, the department secured state grant funding and implemented a multifaceted strategy — including enhanced enforcement, improved signage, optimized signal timing, and community education. As a result, Lansing reduced crash incidents in its identified hotspots by 50%, demonstrating the powerful impact of combining robust data, proactive planning, and collabo‑ rative traffic‑safety measures.
About the Author

Paul Peluso
Editor
Paul Peluso is the Managing Editor of OFFICER Magazine and has been with the Officer Media Group since 2006. He began as an Associate Editor, writing and editing content for Officer.com. Previously, Paul worked as a reporter for several newspapers in the suburbs of Baltimore, MD.